Send Us a Message
Contact Information
Skizzle Technolabs India Pvt. Ltd.
Noel Focus, Kakkanad,
Kerala, India – 682021
Ideacrate Edutainment is a multi-faceted organization with a vision to create a niche in both Children’s Education & Family Entertainment industry. The company aims at operating paramount schools, nurseries, indoor/outdoor play areas, and amusement centers, which will also be a hub for the entire family in UAE and across the globe. Ideacrate has two flagship brands namely Orangewheels and Orangehub catering to various age groups of children. Orangewheels is a fun-filled, one-stop indoor edutainment venue for kids in Abu Dhabi. Orangehub has the latest, and the most loved and all-time favorite arcade games, a race car simulator by Red Bull, 2-lane ‘Highway’ bowling alleys, and a spy mission-themed Laser Tag Arena, with a food and beverage bar and dining area for the whole family.
Pain points
Solution
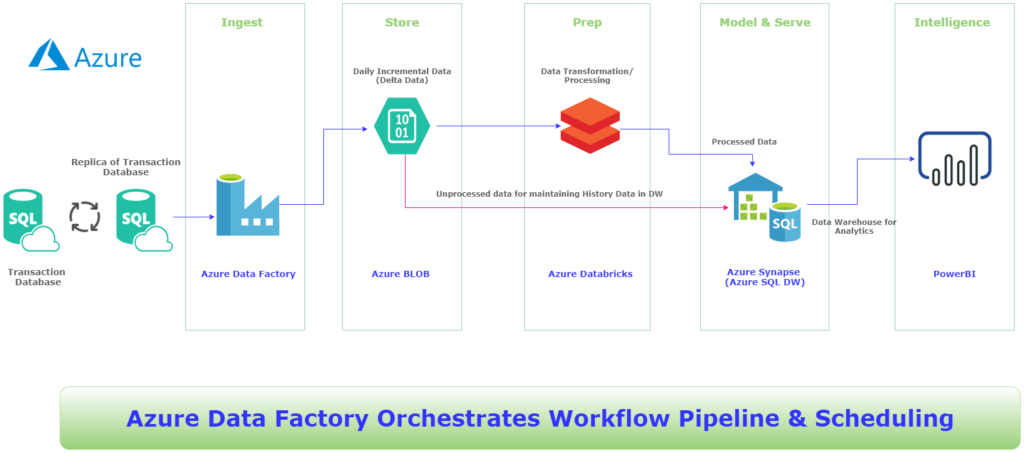
We helped Ideacrate to implement an accelerated data warehouse using SQL Server 2016, high-performance tabular models, and visually appealing Power BI dashboards. Ideacrate went with Microsoft Power BI as their business intelligence software and Microsoft Azure for cloud services. Ideacrate deployed Microsoft Azure technology to collect data from back-end operational systems of the outlets. The operational data from the systems are forwarded to business intelligence platforms like Power BI. Power BI transforms the crude information into informative visuals showing different statuses and statistics of the Ideacrate business. Services such as Azure Stream Analytics, Azure Data Lake Analytics, and Azure SQL Database are used to extract, clean, and prepare operational data in real-time.
We developed the following different kinds of reports:
Solution Architecture

Outcome:
Skizzle Technolabs India Pvt. Ltd.
Noel Focus, Kakkanad,
Kerala, India – 682021